

What Is Google Trends?
Google Trends is a free online tool that allows users to see the popularity of specific keywords over a period of time.
The two main goals of Google Trends are:
- Provide insights into the popularity of search terms.
- Offer insights into market trends, consumer behavior, and cultural phenomena.
![]() Google Trends Logo screenshot from Insight Platforms
Google Trends Logo screenshot from Insight Platforms
Who Uses Google Trends?
Google Trends is used by marketers, researchers, and many other types of people.
What Exactly Can Google Trends Do?
You can use Google Trends to:
- Find searches that are currently trending.
- Identify seasonal search peaks and low points.
- Identify geographic search trends specific to your region.
- See YouTube search trends.
- Analyze retail product search trends.
- Extract data for external analysis.
- More!
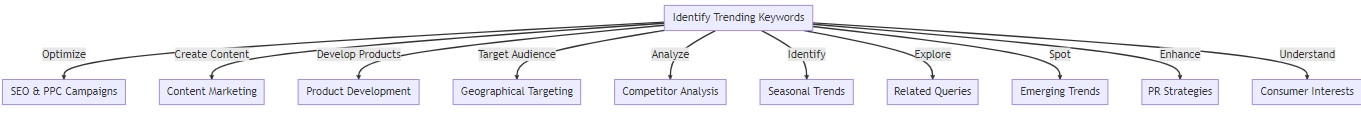
How Does A Business Owner Benefit from Using Google Trends?
See the benefits of Google Trends in our diagram.
Click image to expand
» MORE: Looking for SEO? See our SEO services page.
How To Use Google Trends
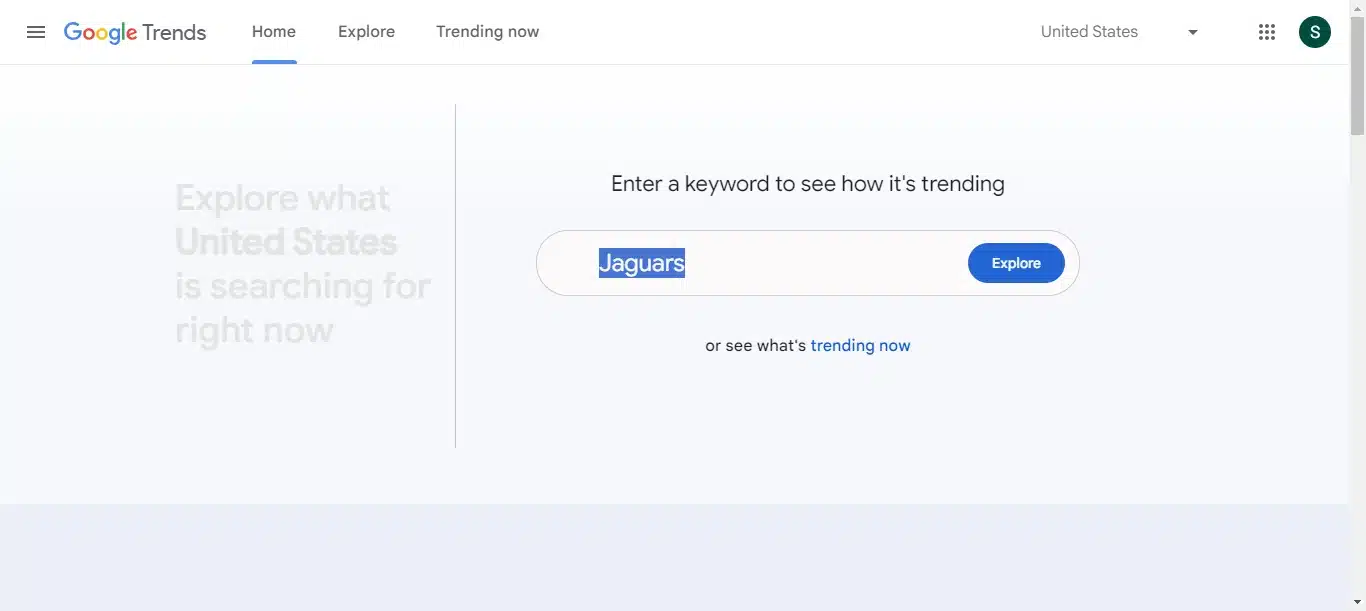
To start using Google Trends, just go to the Google Trends website.
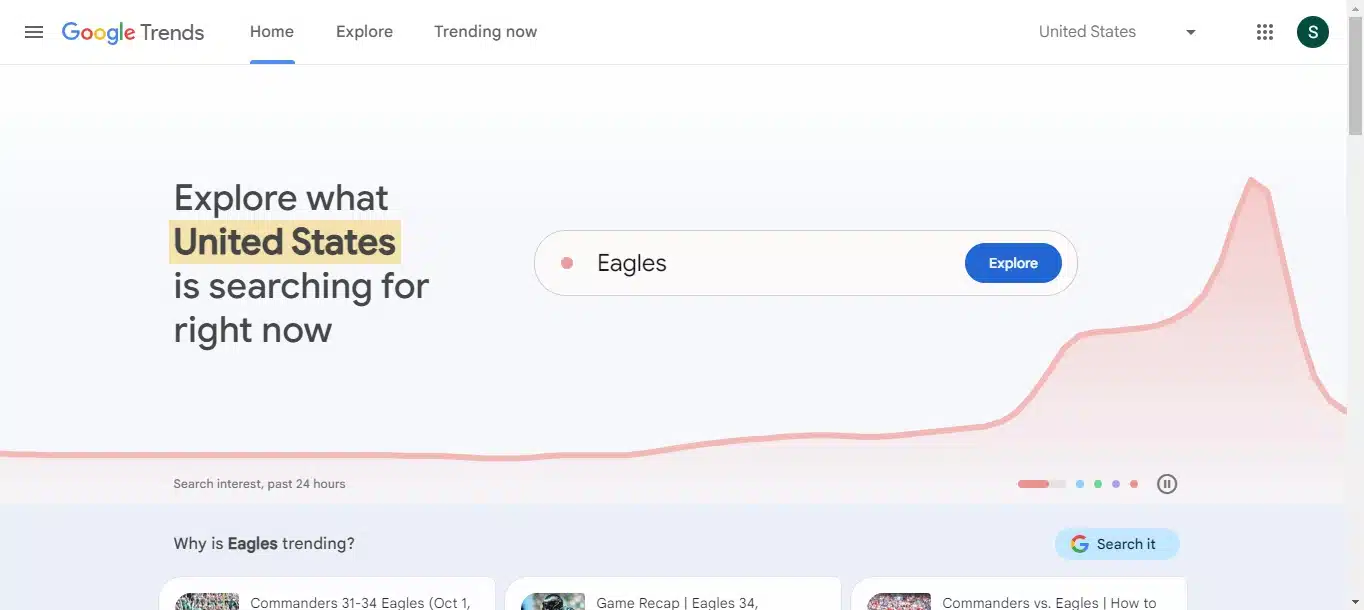
Once you’re there, enter a search term or topic in the search bar, and you’re good to go. 🔎
Changing Search Parameters in Google Trends
Google Trends offers considerable search flexibility, allowing users to change the following parameters:
- Location
- Time frame
- Category (e.g., Arts & Entertainment)
- Type of search (Web Search, Image Search, etc.)
- Number of search terms (Up to 5 at once)
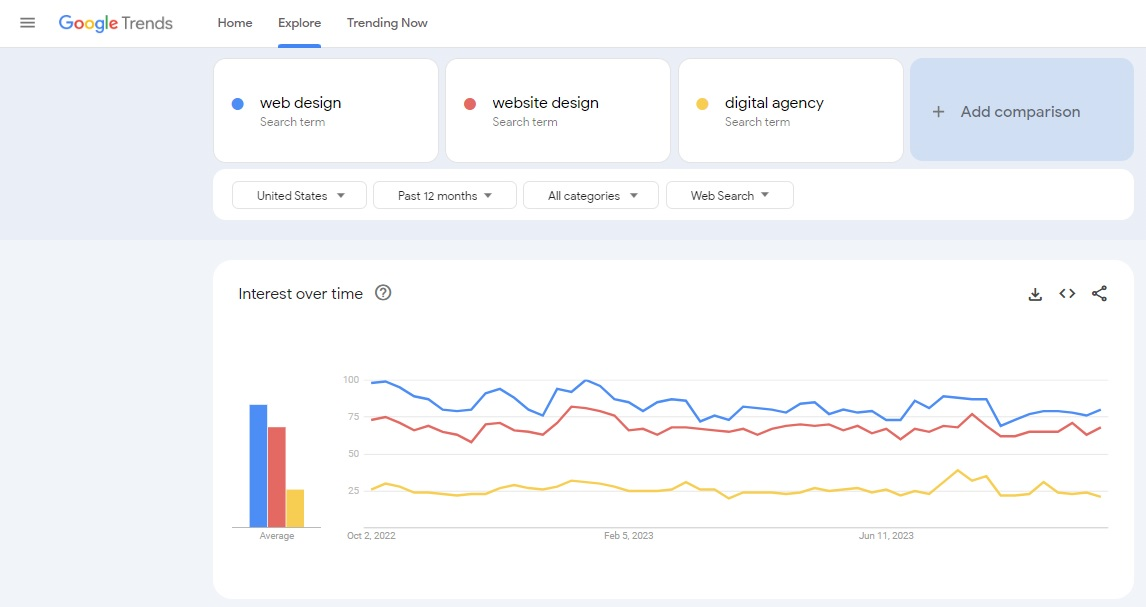
To change search parameters, click on the location, time, categories, and search type tabs. Additionally, you can click on the add comparison box.
You can see what these tabs look like in the example below.
Click the image to expand:
Advanced Google Trends: Five Search Types
Take a look at the Web Search tab in the photo above. This is one of five search types that Google Trends provides.
The search types are:
- Web Search
- Image Search
- News Search
- Google Shopping
- YouTube Search.
Google Trends’ Interest Over Time Metric
Also, take a look at the “Interest over time” chart.
Here’s what Google Trends has to say about it:
“Interest over time numbers represent search interest relative to the highest point on the chart for the given region and time. A value of 100 is the peak popularity for the term. A value of 50 means that the term is half as popular. A score of 0 means there was not enough data for this term.”
What does this mean for Google Trends users in practical terms? 🤔
Answer: The “Interest over time” metric can help users understand what is trending during a specific time frame or in a particular region.
Using Google Trends for SEO Research
Here’s an easy step-by-step overview of how to use Google Trends for SEO:
| Step | Action | Description |
|---|---|---|
| 1 | Visit Google Trends | Go to the Google Trends website. No account is needed, but you can sign in with a Google account if you want. |
| 2 | Enter Keywords | Type in keywords relevant to your business in the “Explore” search bar. You can enter multiple keywords (separated by commas) to compare them. |
| 3 | Set Parameters | Adjust the location, time range, category, and search type according to your needs. |
| 4 | Analyze Interest Over Time | Observe the “Interest over time” graph to understand how the keyword’s popularity has changed. Look for any patterns or notable spikes in interest. |
| 5 | Explore Interest by Region | Check the “Compared breakdown” section to identify where your keywords are trending. This can help you target specific geographical areas in your SEO strategy. |
| 6 | Related Queries | Review the “Related queries” section to discover additional keywords related to your search. These can be used to expand your keyword list and find new content ideas. |
| 7 | Export Data | Use the download button to export data. This can help you keep track of keyword trends over time. |
| 8 | Implement Findings | Apply the insights gained from Google Trends into your SEO strategy. |
| 9 | Monitor | Regularly check Google Trends for updates on keyword popularity and to discover new trends. |
Using Google Trends to Find A Niche (Quick How-to)
Here’s a quick overview of how to use Google Trends to find a niche:
Step 1: Visit Google Trends
Step 2: Start with a broad search term that is relevant to your business.
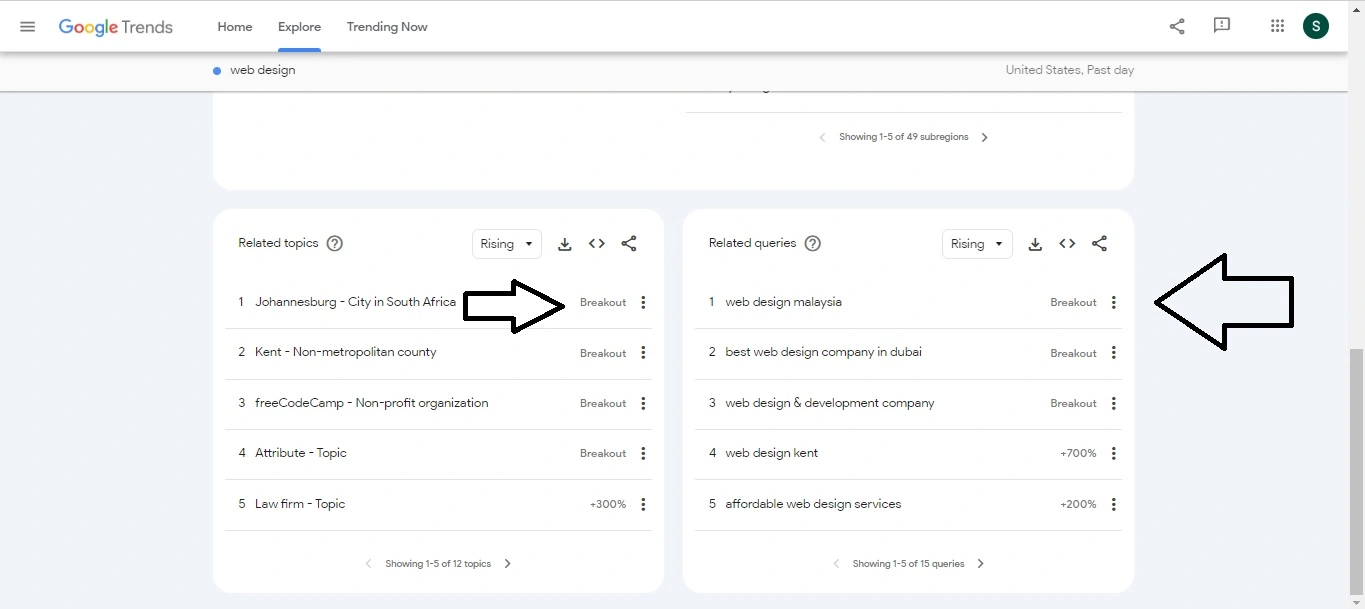
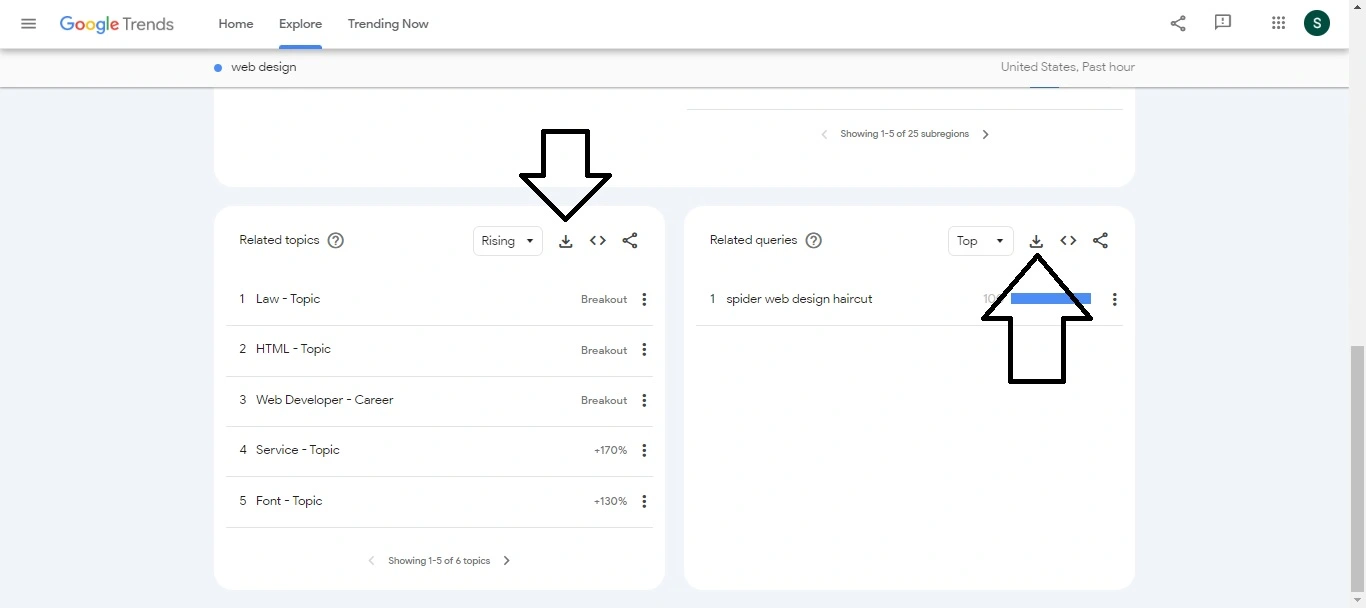
Step 3: Scroll down to related topics and related queries and look for topics and queries that are labeled “Breakout” or have a high percentage increase.
Click the image to expand.
Step 4: Click on any interesting related topic or query to explore it further, checking its “Interest over time.”
Step 5: Check the “Interest by subregion.” This is especially important if you plan on doing local SEO.
Step 7: Look for seasonality trends in your niche to find out whether it sees steady interest or seasonal spikes.
Step 8: Validate your preferred niche by checking for existing products, services, and content and then seeing what gaps you can fill.
- file.
What Does Breakout Mean on Google Trends?
In Google Trends, “Breakout” refers to a search term that has grown by more than 5,000% over a given time frame.
If, for instance, you’re looking at trends over the past 30 days, you’ll see Breakout terms relevant to that period of time.
Keep in mind that Breakout terms might not necessarily have huge search volumes. A Breakout just signals a large spike in searches over a specific period.
» MORE: Enhance Your Existing Site with an SEO-friendly Website Redesign
How to Export and Embed Google Trends Data
Here’s a guide on how to export and embed from Google Trends.
Exporting Data from Google Trends
- Visit Google Trends.
- Enter a search term with your desired search parameters.
- Once you have the data you’re interested in, look for the download icon (it’ll be an arrow pointing downward or a floppy disk icon).
- Click on the icon, and the data will be downloaded as a CSV file.
Embedding Google Trends Charts into a Website
After finding the information you want to share, look for and click the embed icon (usually represented as ‘</>’).
A window will pop up with an HTML code for you to copy.
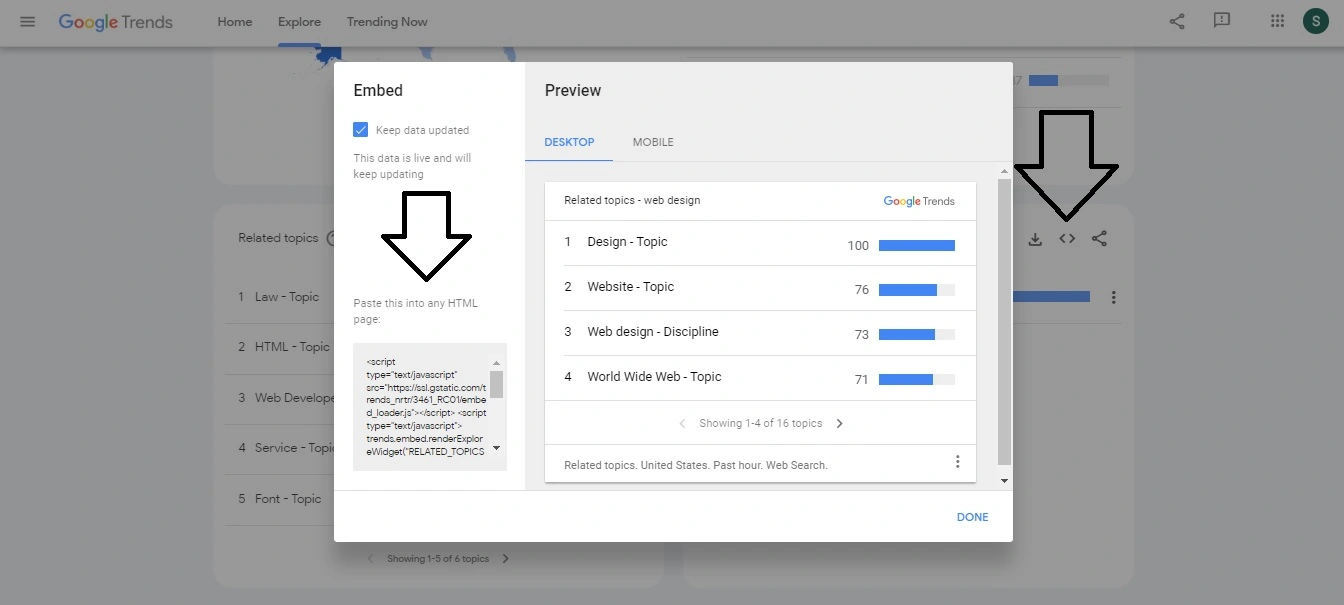
Paste the copied HTML code into the source code of your website or blog where you want the chart to appear.
Is Google Trends Accurate?
Google Trends comes directly from Google, so it certainly offers a healthy approximation of search trends. With that said, nothing is perfectly accurate, not even Google.
It’s always a good idea to check the trends you see against other sources to make sure you’re getting the full picture.
Google Trends Alternatives
SEMrush
Uses: Keyword research, site audit, competitor analysis, backlink tracking, and more.
Ahrefs
Uses: Keyword explorer, site audit, content explorer, rank tracker, and more.
Moz
Uses: Keyword research, SEO audit and crawl, backlink research, and rank tracking.
BuzzSumo
Uses: Content insights, influencer identification, content alerts, and competitor analysis.
AnswerThePublic
Uses: Visual keyword research, content ideas, and data on what users are searching for.
Ubersuggest
Uses: Keyword ideas, content ideas, backlink data, and rank tracking.
SimilarWeb
Uses: Website traffic, engagement metrics, audience insights, and competitor analysis.
Exploding Topics
Uses: Discover trending topics before they take off and see categorized trends.
SEO Friendly Web Design with Sage
Google Trends is a useful tool for enhancing your website’s SEO. If you’d like to enhance your search engine optimization further with SEO-friendly web design, let’s jump on a call.
For more information, you can also see our Web Design Services page.